
Golf Betting Tips: A Statistical Approach to Every Market and Round
 Available in US

Seven years ago I placed my first golf bet — a 66/1 outright on a mid-tier player at the Valero Texas Open because a podcast host said he was "due." The golfer missed the cut by four shots, and I learned more from that losing slip than from any tipster thread I'd read in the months before. Golf betting rewards patience, data and a clear process. It punishes narrative, recency bias and lazy staking. That distinction has shaped every card I've built since.

The market has changed beyond recognition in the years I've been tracking it. The PGA Tour recorded a 20% increase in golf betting handle in 2025 — the fourth consecutive year of double-digit growth — and the infrastructure behind it has expanded to match. We now have strokes gained breakdowns available within hours of a round finishing, course-fit profiling tools that would have seemed absurd a decade ago, and in-play markets granular enough to bet on a single approach shot. For punters in the UK, where each-way terms and competitive bookmaker pricing create a distinct edge, this is a landscape built for analytical minds.
This guide is the resource I wish had existed when I started. Not a list of picks for this week's tournament, but a structural framework: how golf betting markets work, which statistics separate sharp selections from guesswork, and how to build a strategy that survives a full 48-event season. Everything here is grounded in data I use in my own process — strokes gained profiles, implied probability calculations, field-strength adjustments — because the numbers keep you honest when your gut says otherwise.
Whether you're placing your first each-way bet or refining a model you've been running for years, the principles in this guide apply. The sport is the same; the edge is in how you prepare for it.
What This Guide Covers — and Why the Numbers Matter
- Golf betting handle has grown 20% year-on-year, but most punters still rely on gut feeling rather than strokes gained data, implied probability or field-strength analysis.
- Each-way betting, the backbone of UK golf wagering, requires understanding place terms, dead heats and payout mechanics before it delivers consistent returns.
- A repeatable strategy built on value identification, bankroll allocation and weekly review outperforms any single tip — this guide walks through each element.
- The UK market generates roughly £2.48 billion in annual sports betting GGY, with golf one of the fastest-growing segments inside it.
Golf Betting Markets: From Outrights to Micro-Props
I spent my first full season betting exclusively on outright winners. The strike rate was terrible — roughly one winner in every 30 bets — and I burned through half my bankroll by the summer swing. What I hadn't grasped was that outright winner markets represent a single corridor in a building with dozens of rooms. Golf offers more bet types than almost any other sport, and understanding the full map is the first step toward building a card that doesn't depend on a single long-shot result to stay profitable.
The global sports betting market sits at roughly $162.5 billion in 2025, projected to reach $575 billion by 2035. Europe alone accounts for 41% of that figure. Golf's share is a fraction of football or tennis, but that's precisely what makes it attractive: thinner markets, softer pricing and more opportunities for a punter who's done the homework. If you're new to the sport's betting side, a beginner's walk-through of markets, slips and first wagers is a solid starting point before diving into the detail below.
Outright Winner
Pick the tournament winner from a field of 120-156 players. Highest potential payout, lowest strike rate. Each-way terms typically 1/4 or 1/5 odds for 5-8 places.
Top 5 / Top 10 / Top 20
Position-finish markets with progressively higher strike rates and lower odds. Useful for reducing variance while staying in outright-adjacent territory.
Head-to-Head and 3-Ball
Compare two or three named golfers over a single round or the full tournament. Removes the field entirely — your only concern is relative performance.
First Round Leader
Predict who leads after 18 holes on Thursday. Tee-time draw and course conditions play outsized roles.
Make/Miss Cut
Binary market on whether a player survives the Friday cut. Useful for targeting consistent performers or fading volatile ones.
Props and Specials
Hole-in-one, top nationality, round scoring, first-hole result. Entertainment-oriented but occasionally mispriced.

Before I walk through each market category, three terms appear constantly in golf betting — and misunderstanding any of them will cost you real money.
Outright — a bet on a player to win the entire tournament. In golf, outright odds typically range from 5/1 for an elite favourite to 500/1 or longer for a field filler. Because only one player out of 120+ can win, outright markets carry inherently high variance.
Each-way — a two-part bet. Half your stake backs the player to win; the other half backs them to finish in the "places" (typically top 5 or top 8, depending on field size and bookmaker). If your pick finishes fourth in a market paying 5 places at 1/4 odds, the win half loses but the place half pays out at a quarter of the outright price. Central to UK golf betting; this structure doesn't exist in the same form in most other countries.
Dead heat — when two or more players tie for a finishing position that affects payout thresholds (say, three golfers tied for fifth when your bet covers top 5). Your stake is divided by the number of players sharing that position before the payout is calculated. Dead heats erode returns more than most beginners expect, particularly in top-finish markets where ties are common.
The mistake most punters make — and I made it for a long time — is treating all these markets as variations of the same question. They aren't. An outright bet rewards deep-field analysis. A head-to-head rewards granular stat comparison between two players. A make/miss cut rewards scoring-average calculations against the projected line. Each market is a different problem demanding a different analytical lens.
Outright Winner and Top-Finish Markets
The outright winner market is golf betting's signature product — and its most unforgiving. You're picking one player from a field that regularly exceeds 150 entries at regular tour events, or 70-80 at elevated-field tournaments. Even a player with a 10% chance of winning (which would make them the clear favourite) loses nine times out of ten. That mathematical reality shapes everything: your staking, your expectations and your timeline for judging results.
Top-finish markets — top 5, top 10, top 20 — compress the variance. A player priced at 25/1 for the outright might be 4/1 for a top 5 finish and 2/1 for a top 10. The payout shrinks, but the strike rate climbs dramatically. In my own records, top 10 bets produce a positive result roughly 30-35% of the time when my process is working correctly. Outright winners come in at under 5%. The question isn't which market is "better" — it's which market fits your staking plan and risk tolerance.
Outright odds example — same player, same tournament
| Market | Fractional | Decimal | Implied probability |
|---|---|---|---|
| Outright winner | 25/1 | 26.00 | 3.85% |
| Top 5 finish | 9/2 | 5.50 | 18.18% |
| Top 10 finish | 2/1 | 3.00 | 33.33% |
| Top 20 finish | 4/5 | 1.80 | 55.56% |
Notice how the implied probabilities stack. The bookmaker is telling you this player has about a 4% chance of winning but a 56% chance of finishing in the top 20. Same player, same event, entirely different risk profiles. The punter who bets 25/1 outrights needs the bankroll to absorb 20+ consecutive losses. The punter who backs top 20s needs the discipline to accept smaller payouts and the edge to consistently identify underpriced finishing positions.
Each-Way Betting at a Glance
If there's one market that defines UK golf betting, it's each-way. I've spoken to punters in the US and Australia who have never encountered the format, yet for anyone betting through a UK bookmaker it's the default structure for outright golf wagers. The concept is deceptively simple: you place two bets of equal size, one on the player to win and one on them to finish in the places. The complexity — and the edge — lives in the details.
Each-way mechanics in brief: An each-way bet at 40/1 with 1/4 odds for 5 places means your win half pays 40/1 if the player wins, and your place half pays 10/1 (40 divided by 4) if they finish in the top 5. A £5 each-way bet costs £10 total (£5 win + £5 place). If the player finishes third, you lose the £5 win stake but collect £55 from the place half (£5 at 10/1 plus your £5 stake back). Net profit: £45.
Place terms vary between bookmakers and change depending on the size of the field. A standard 156-player event might offer 1/4 odds for the first 5 places, while a major could extend to 8 places. Enhanced place promotions push that number even higher during marquee weeks. The variation matters enormously — the difference between 5 places and 8 places at 1/4 odds can turn a losing each-way bet into a winning one.
I've built a detailed breakdown of each-way golf betting covering place terms, payout calculations and volatility-based strategy. For now, the key takeaway is this: each-way is not just a "safety net" for outright bets. It's a distinct market with its own pricing logic, its own value opportunities, and its own traps.
Head-to-Head, 3-Ball and Prop Markets
Not every golf bet requires picking a tournament winner. Matchup markets strip away the 150-player field and ask a simpler question: which of these two (or three) golfers will post the lower score? That simplicity is what drew me to matchups early on, and it's still where I place a significant share of my weekly bets.
Head-to-Head (2-Ball)
Two named players, 18 or 72 holes. Bookmaker pairs them based on similar odds ranges. Dead heats are less common but possible. Your analysis focuses entirely on direct statistical comparison: who is better tee-to-green this season, who scrambles more effectively on this type of course, who handles pressure putting under tournament conditions. The rest of the field is irrelevant.
3-Ball Matchup
Three players grouped by tee time, typically for a single round. Dead heats are more frequent (two players posting the same score). Pricing reflects three outcomes rather than two, which creates wider margins for the bookmaker — but also wider gaps for the punter to exploit when one player's form is dramatically different from the other two.
Prop markets sit at the other end of the spectrum: hole-in-one bets, top nationality, first-hole scoring. Most carry heavy margins and exist primarily for entertainment. That said, I've found occasional pricing errors in props during major weeks, when bookmakers rush to create hundreds of specials and don't always get the numbers right. The rule is straightforward: if you can model a prop with real data, it's worth considering. If you can't, it's a punt, not a bet.
Golf Stats That Separate Sharp Picks from Guesswork
A mate of mine bets golf every week using nothing but "course form" — he checks who finished well at the same venue last year and backs them again. His logic sounds reasonable until you realise that most PGA Tour courses rotate on and off the schedule, player rosters shift, and conditions change enough between seasons to make historical finishing positions close to meaningless in isolation. He's been betting this way for three years. His ROI is negative 12%. The data tells you why.
Golf produces more measurable data per player per round than any major sport except perhaps baseball. Every drive, approach, chip and putt is tracked, time-stamped and available for analysis. The question isn't whether the numbers exist — it's knowing which numbers to look at, and more importantly, which to ignore.
Statistics that matter for golf betting: Strokes gained (all four sub-categories), greens in regulation (GIR), scrambling percentage, driving accuracy, birdie or better percentage, bogey avoidance, proximity to the hole from various distances, and scoring average relative to field. Of these, strokes gained is the single most predictive framework for tournament performance — the others are useful supporting indicators, not primary inputs.
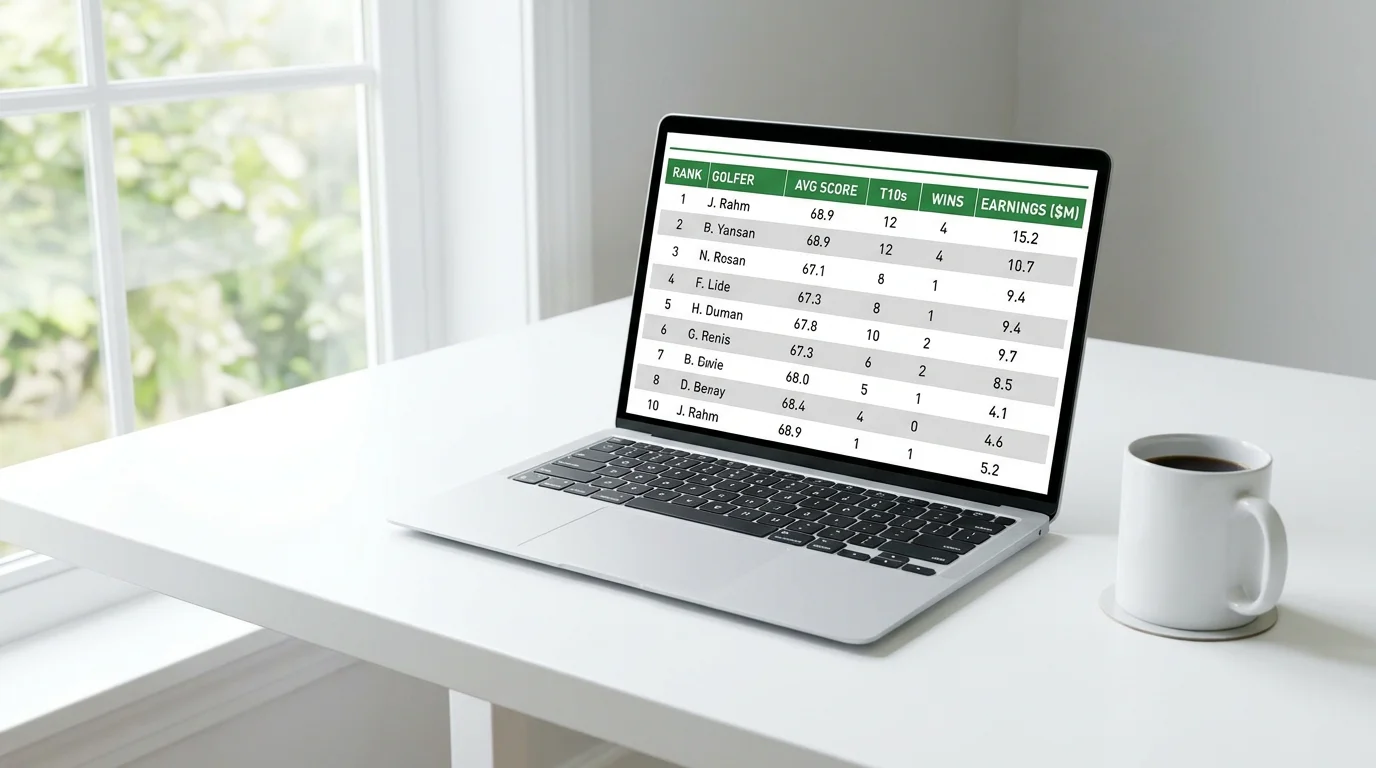
Pamela Maldonado, a sports betting analyst whose work I follow closely, described it well: "Golf betting is a slow-burn panic, like a 3-footer that suddenly feels twice as long. The sharper approach is building a card with intention and direction." That intention comes from structuring your analysis around data that predicts future performance, not data that describes past results. There's a crucial difference. Finishing positions tell you what happened. Strokes gained data tells you how and why it happened — and that process-level information travels forward to the next event far more reliably.
The PGA Tour LIVE Betcast expanded from 50 hours across 6 tournaments in 2025 to over 400 hours across 12 tournaments in 2026 — a 700% increase. That explosion in live coverage has opened a new tier of data for in-play bettors, with shot-level information reaching screens within seconds of a ball landing.
The practical question is: how do I access this data without drowning in spreadsheets? For PGA Tour events, strokes gained data is publicly available through the tour's statistics portal, updated after each round. For the DP World Tour, coverage is thinner — you'll need third-party providers or manual compilation. Either way, the workflow starts with the same question: what does this course demand, statistically, and which players in this field match that profile?
Raw stats without context are noise. Driving distance means nothing at a short, tight course. Putting average means nothing without knowing green speeds and contours. The skill is in matching the right metrics to the right venue, which brings us to strokes gained — the framework that made course-stat matching systematic rather than subjective.
Strokes Gained as a Betting Lens
Strokes gained measures how many shots a player saves (or loses) relative to the field average from every position on the course. Traditional stats like driving distance or GIR tell you what a player did; strokes gained tells you how much that action was worth compared to everyone else playing the same holes in the same conditions. It's the difference between knowing a player hit 14 greens and knowing that those 14 greens gained him 2.3 shots over the field because his approaches were landing an average of 15 feet closer to the pin.
SG: Tee-to-Green — the combined strokes gained from driving, approach play and shots around the green. This composite metric captures everything except putting and is widely considered the most stable predictor of week-to-week performance. A player who gains two strokes tee-to-green on the field is generating elite-level ball-striking, regardless of where the putts fall.
SG: Approach — strokes gained specifically on approach shots (typically from 100+ yards into the green). This is the single most correlated sub-category with tournament finishing positions. If you track one number per player per week, make it this one.
SG: Putting — strokes gained on the green. The most volatile of the four categories — putting performance fluctuates significantly from week to week, even for elite players. A golfer who gains 1.5 strokes putting one week might lose 0.8 the next. For betting purposes, putting is important context but a poor primary predictor.
The practical application for your betting card is direct: identify what a course demands (tee-to-green skill? scrambling? long putting on fast greens?), then filter the field by the matching strokes gained categories. My guide to strokes gained for golf betting breaks this workflow down into a step-by-step weekly process, including where to find the data and how to weight each category for different course types.
Course-Fit Profiling in Brief
Every golf course has a statistical personality. Augusta National rewards length off the tee and precise iron play to elevated greens with severe slopes. A links course on the Open rota demands low ball flight, creative scrambling and comfort in wind. A tight parkland layout puts a premium on driving accuracy and short-game touch over raw power. These aren't subjective impressions — they're measurable profiles built from years of ShotLink and scoring data.

Course-fit profiling is the process of translating a course's physical characteristics into a weighted set of statistical demands, then ranking the field against those demands. In my own process, I build a simple profile for each venue: which strokes gained categories have the highest correlation with past leaderboard finishes? How much does driving distance matter relative to approach accuracy? Is putting variance unusually high or low at this venue? The answers differ dramatically from course to course, and they change the entire composition of my card.
This is where historical course form becomes useful — not as a primary indicator, but as a validation layer. If a player has finished top 20 in three of his last four visits, and his strokes gained profile matches the course demands, that's a genuine signal. If the course form exists but the statistical profile doesn't match, the past results are probably noise — a product of a hot putting week or a weak field, not a repeatable skill.
Course-fit profiling is a deep topic that warrants its own space. A full methodology — including how to build profiles for links, parkland and resort courses, and where course history data can mislead — sits in the dedicated course-fit analysis guide.
Building a Golf Betting Strategy That Lasts a Full Season
Let me tell you about the most expensive month of my betting career. August 2021. I'd had a strong spring — hit a couple of 33/1 each-way places, one outright top 5 at decent odds — and convinced myself I'd cracked the code. So I doubled my unit size for the FedEx Cup Playoffs. The first week was a total wipeout. I chased with bigger bets in week two. By the time the Tour Championship finished, I'd erased four months of profit in three weeks. The lesson was brutal but permanent: a golf betting strategy has to be built for a full season, not a hot streak.
That's doubly true given the scale of action flowing into these events. The three FedEx Cup Playoff tournaments in August 2025 saw betting handle rise 50% year-on-year, with the Tour Championship more than doubling its volume. More money means sharper lines, quicker odds adjustments and less room for sloppy process.
Scott Warfield, the PGA Tour's Vice President of Gaming, framed the trajectory in terms I think every punter should hear: "We're trying to grow the pie and get more people engaged around the sport. We saw that manifest last year and believe it will continue in 2026." The pie is growing. The question is whether your process is sharp enough to take a slice.

A full framework for building that process — from value identification to weekly reviews — lives in my golf betting strategy guide. Here, I want to establish the foundational principles that underpin everything else.
The first principle is consistency. Your selection method, staking plan and review cycle should be the same in week 3 as in week 43. Emotional adjustments — betting more after a win, cutting back after a loss, abandoning your model because it "feels wrong" — are the single biggest source of long-term loss in golf betting.
The second principle is diversification across market types. An all-outright portfolio has a standard deviation that would make most bettors ill if they saw it plotted over 50 events. Mixing outrights with each-way bets, top-finish positions and select matchups smooths the equity curve without sacrificing expected value.
The third principle is ruthless self-honesty. Track every bet, calculate your ROI by market type and by tour, and confront the results without rationalising. If your matchup bets are profitable but your outrights are bleeding, the data is telling you where your edge lives — and where it doesn't.
Do
- Set a fixed unit size before the season starts and stick to it.
- Define your selection criteria in writing — course-fit profile, form window, strokes gained filters — before looking at odds.
- Track ROI by market type, not just overall profit.
- Review your process weekly, adjusting model inputs rather than stakes.
Don't
- Increase unit size after a winning streak or decrease it after a losing run.
- Bet on a tournament you haven't researched because the field "looks fun."
- Back a player solely because they won recently — last week's winner reverts to the field mean faster than you think.
- Ignore your tracking spreadsheet when results are uncomfortable.
Finding Value: Odds vs True Probability
Value is the gap between what the bookmaker thinks will happen and what you think will happen, expressed in probability. If you believe a player has a 6% chance of winning a tournament and the bookmaker is offering odds that imply a 4% chance, you've found value — even though the player will still lose 94 times out of 100. This concept is the engine of all profitable sports betting, and it's especially relevant in golf because the large field sizes create more pricing inefficiencies than you'll find in a two-team football match.
The practical starting point is converting odds into implied probability. Every set of odds is a percentage in disguise, and comparing that percentage against your own estimate of a player's chances is how you decide whether a bet is worth placing.
Implied probability from fractional odds
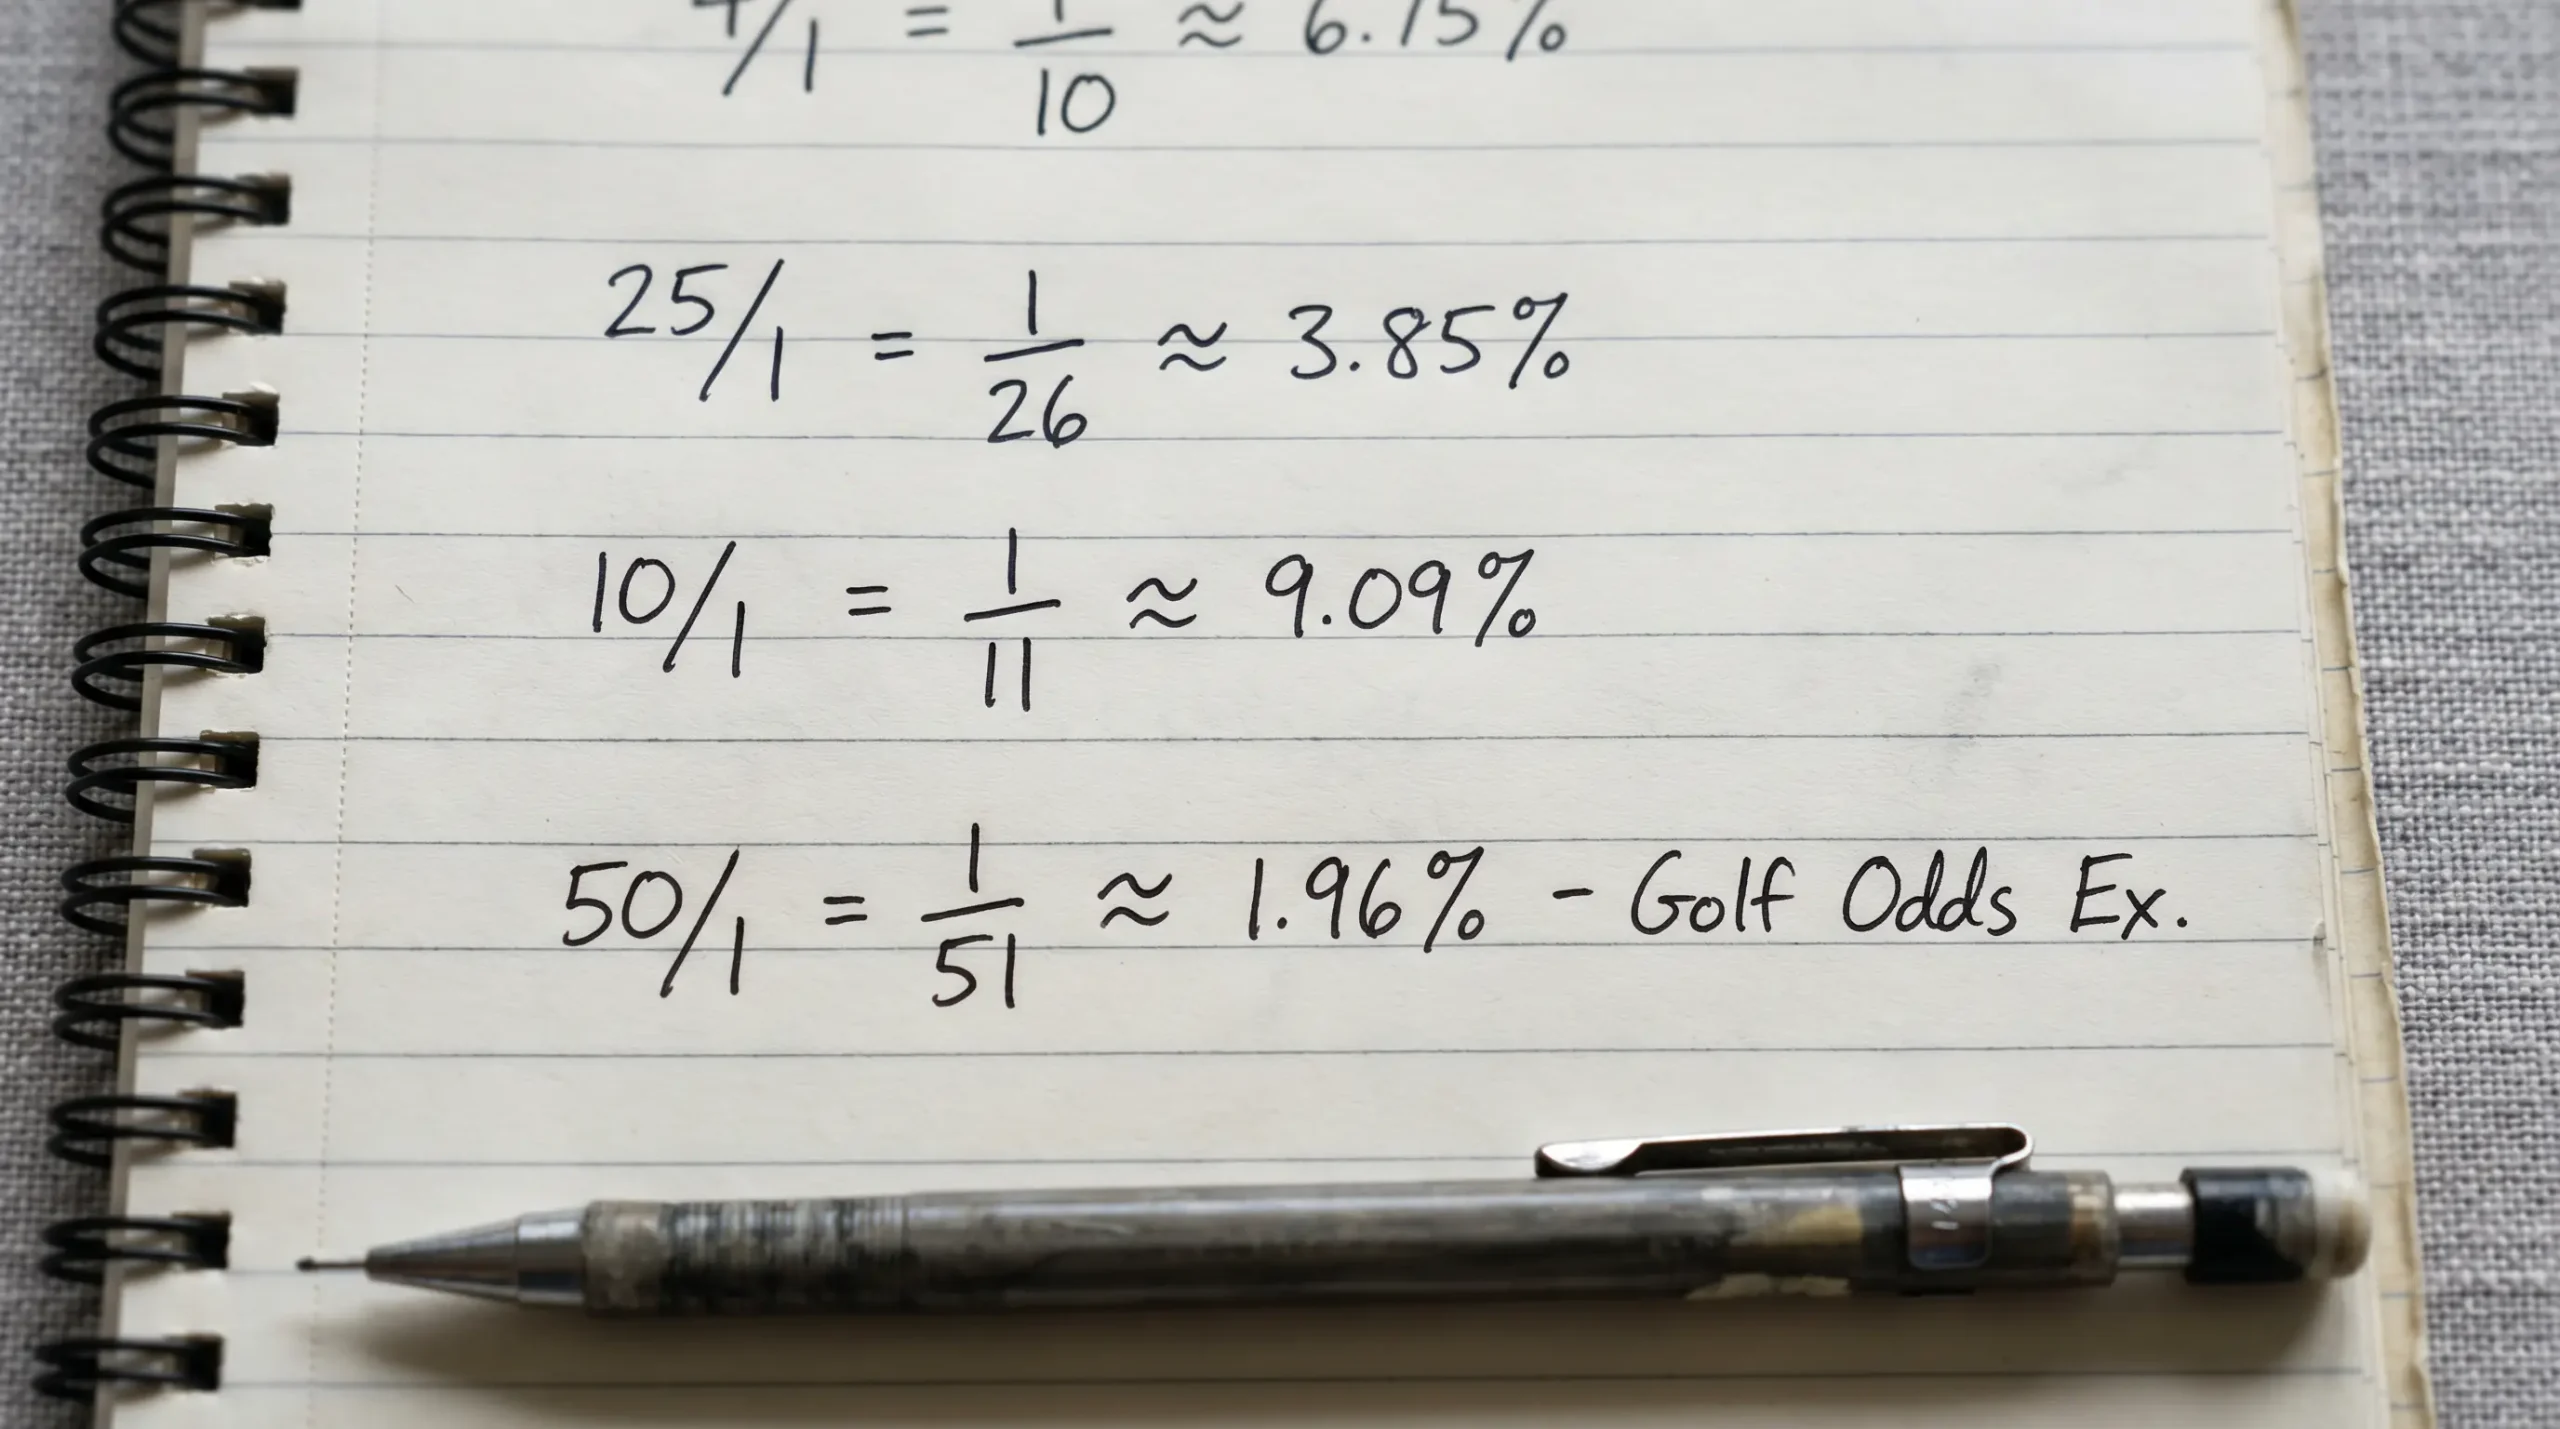
Suppose a player is priced at 33/1 to win. The implied probability formula is: stake / (stake + payout) = 1 / (1 + 33) = 1/34 = 2.94%. The bookmaker is pricing this player at roughly a 3% chance of winning.
Now run the same player through your model. Your course-fit profile, strokes gained analysis and form filter suggest a true probability closer to 5%. The difference — 5% minus 2.94% — is your edge. Over hundreds of bets at similar edges, that gap compounds into profit.
If your model says 2.5% and the bookmaker says 2.94%, there's no value — the price already exceeds your estimate. Pass and move to the next player on your shortlist.
Two warnings. First, your probability estimate has to come from a genuine analytical process, not a feeling. "I think he's due" is not a 5% probability assessment. Second, value betting requires volume. A single value bet at 33/1 will lose far more often than it wins. The edge only materialises over dozens or hundreds of similar bets, which is why bankroll management isn't an optional extra — it's a structural requirement.
Bankroll Allocation for a 48-Event Calendar
The PGA Tour and DP World Tour combined run close to 90 events per year. Even if you're selective — and you should be — you'll likely find 40 to 50 tournaments worth betting on across both tours. A bankroll built for a weekend of football won't survive a golf season. The variance profile is different: longer odds, lower strike rates, and a calendar that stretches from January to November with no meaningful off-season break.
My own rule is simple. I split a season-long bankroll into 100 units. Each standard bet uses 1 unit. High-conviction plays — where three or more of my filters converge strongly on one player — might use 1.5 units, but never more. That means I can sustain 50 consecutive losing bets and still have half my bankroll intact. In golf, 50 consecutive losses on outright bets isn't a disaster; it's a plausible three-month stretch for a punter with a sound process and unfortunate variance.
Before placing any golf bet
- Confirm the bet fits within your unit-size limit for this event and market.
- Verify your course-fit profile matches at least two strokes gained categories for this player.
- Check your form-window data: does performance over the last 24 rounds support the selection?
- Convert the offered odds to implied probability and compare against your model estimate.
- Ensure total weekly exposure (all bets combined) does not exceed 10% of your remaining bankroll.
- Record the bet in your tracking spreadsheet before placing it — not after.
If any single point on that list can't be satisfied, the bet doesn't go on. I've walked away from players I genuinely believed would win because the price didn't offer value or my weekly exposure was already at the limit. Discipline at the staking stage protects you from every analytical mistake you make at selection.
Reading Golf Odds: Fractional, Decimal and Implied Probability
I once watched a fellow punter at a bookmaker counter stare at a golf coupon for a solid minute, turn to me and ask, "What does 80/1 actually mean in real money?" It's a fair question — and one that far too many bettors skip over. The UK sports betting market generates approximately £2.48 billion in annual gross gaming yield, one of the largest regulated markets globally. A significant portion comes from people who don't fully understand the numbers on the slip in front of them.
Fractional odds are the default format in UK bookmaker shops and on most UK-facing websites. When you see a player listed at 40/1, those two numbers tell you the profit relative to your stake: for every £1 you wager, you receive £40 in profit if the bet wins, plus your original £1 stake returned. At 7/2, you receive £3.50 for every £1 staked. At 4/9, you receive roughly £0.44 for every £1 staked — those are "odds-on," meaning the bookmaker considers that outcome more likely than not.
Fractional vs decimal — the same odds, two formats
| Fractional | Decimal | £10 stake returns |
|---|---|---|
| 80/1 | 81.00 | £810 |
| 25/1 | 26.00 | £260 |
| 7/2 | 4.50 | £45 |
| 4/5 | 1.80 | £18 |
| 1/3 | 1.33 | £13.33 |
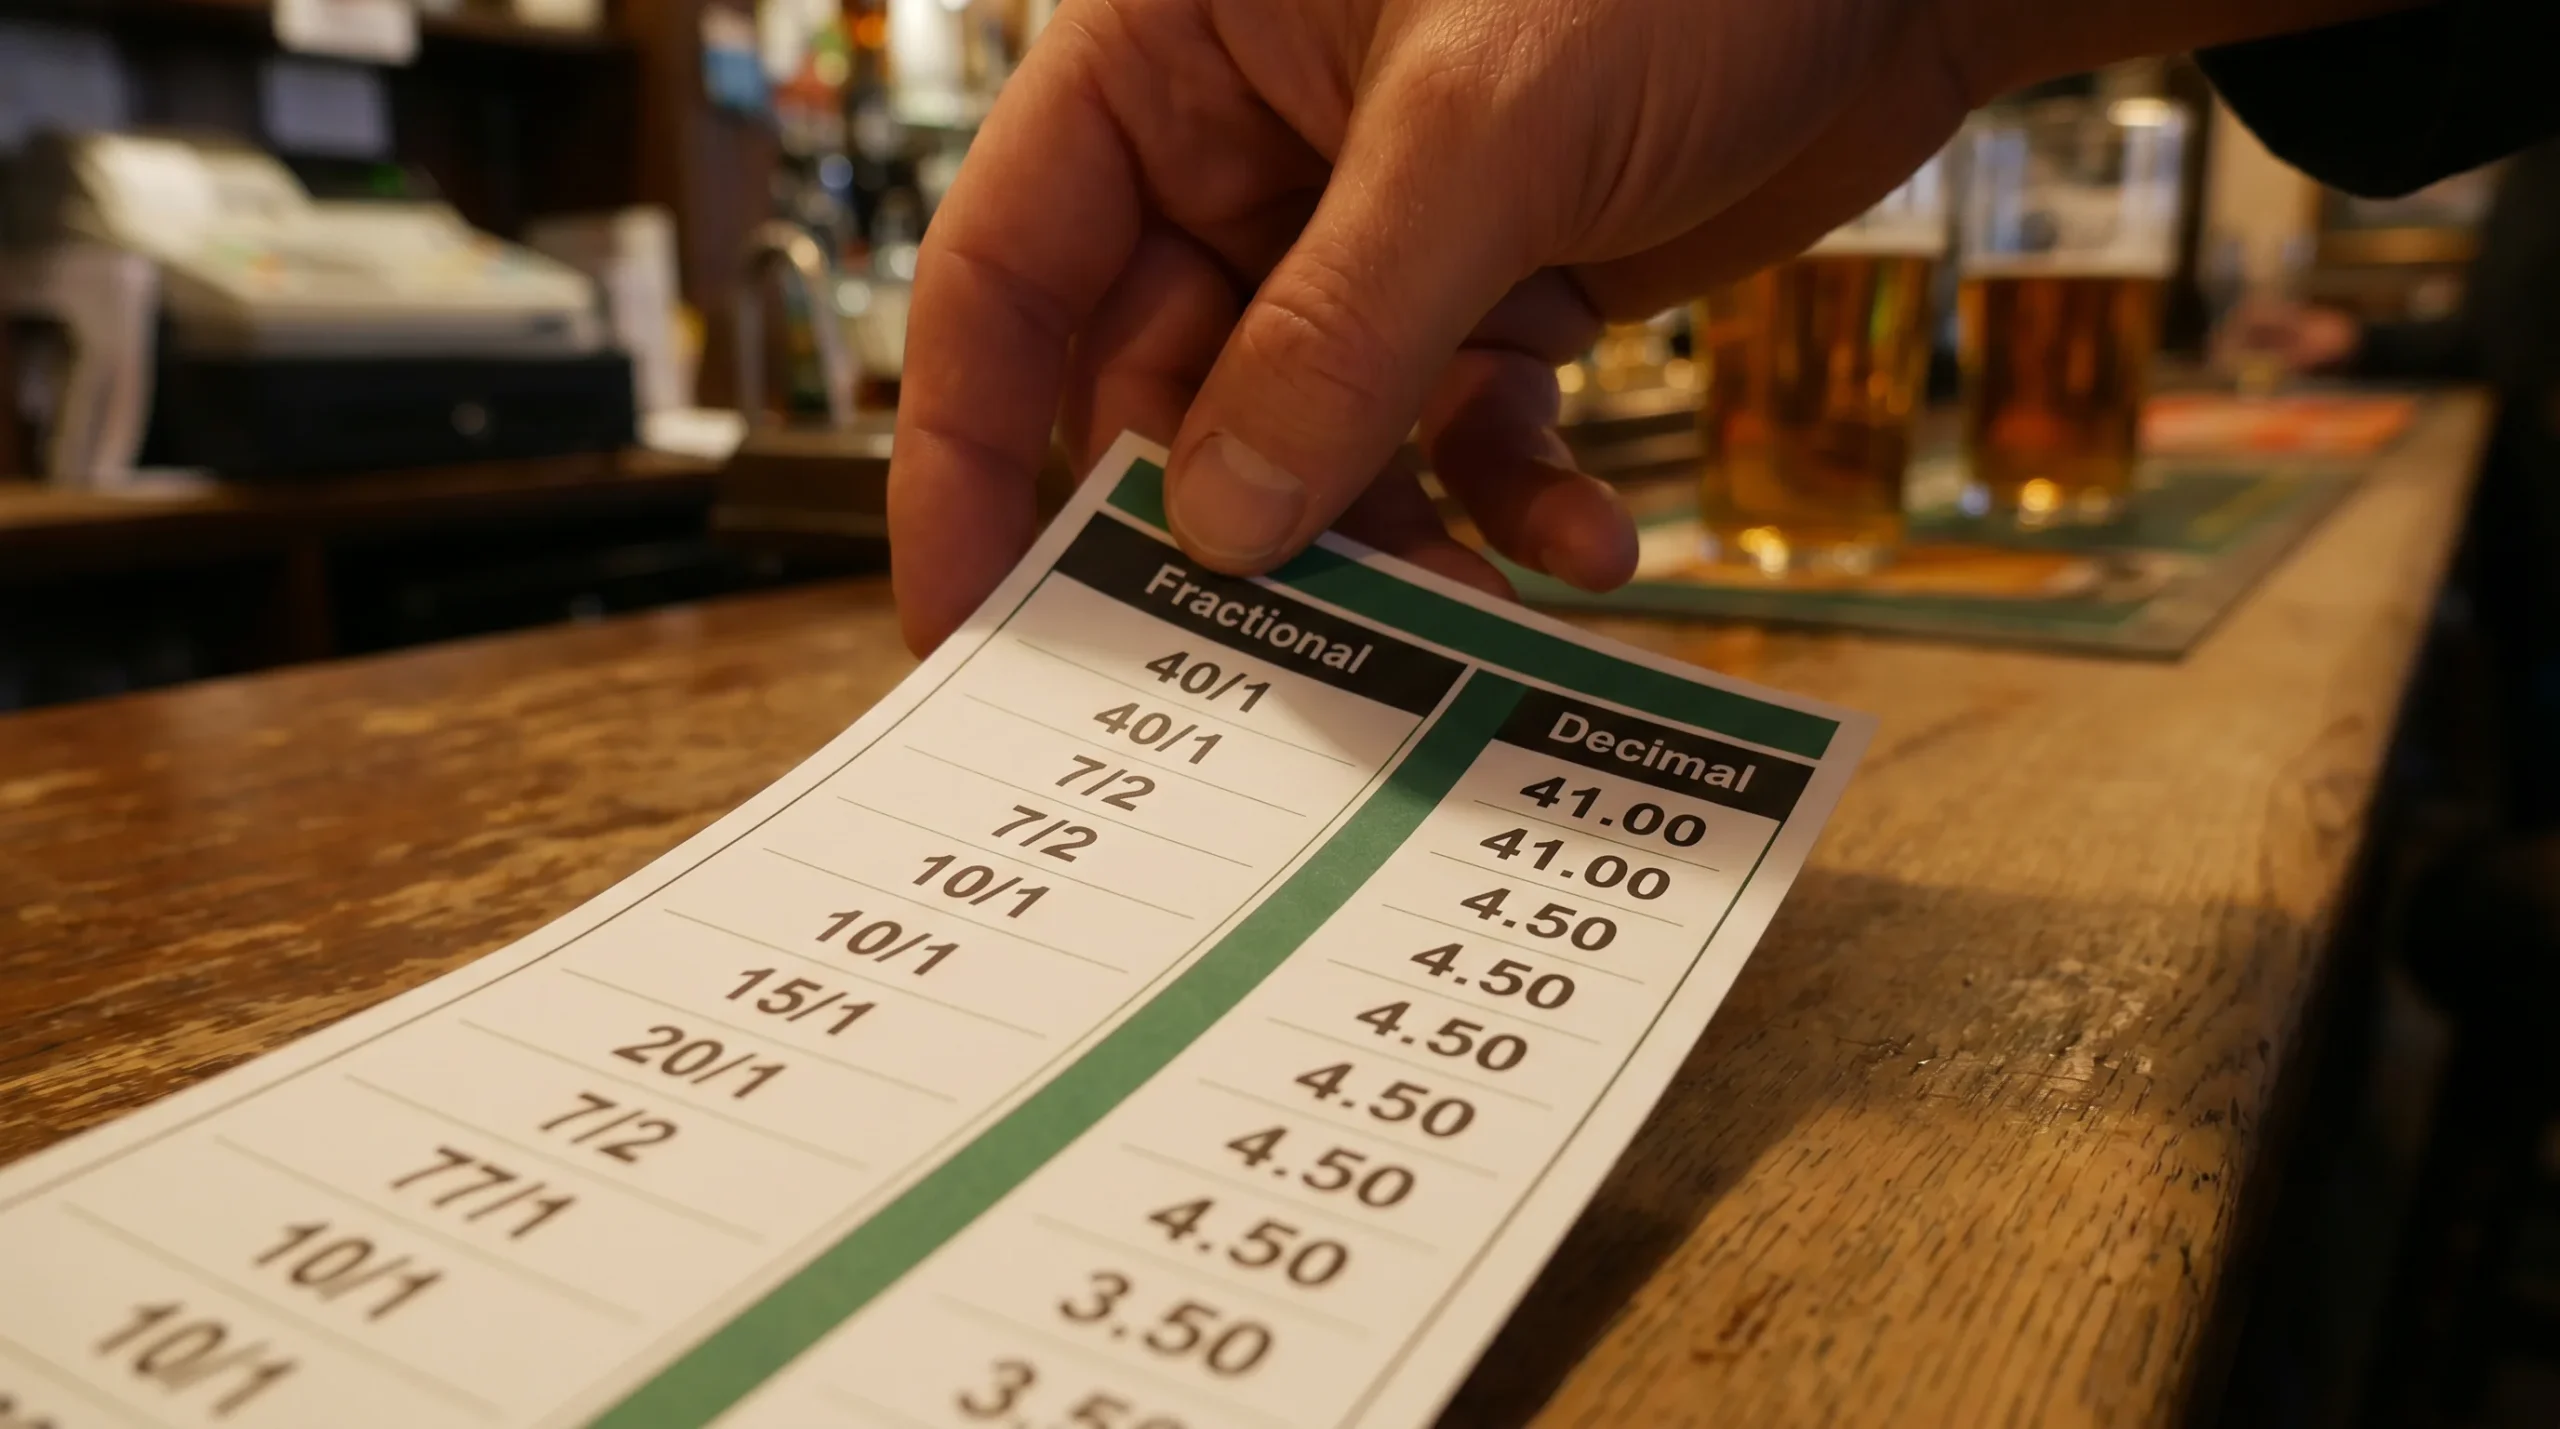
Decimal odds, standard on European exchanges and increasingly common on UK websites, bundle the stake into the return figure. A player at 26.00 decimal pays £26 for every £1 wagered, including the stake. The conversion is mechanical: take the fractional odds, divide the first number by the second, add 1. So 25/1 = (25/1) + 1 = 26.00.
Implied probability and overround
To convert decimal odds to implied probability: 1 / decimal odds = probability. A player at 26.00 decimal: 1/26 = 3.85%. A player at 4.50 decimal: 1/4.5 = 22.22%.
If you add the implied probabilities of every player in a golf outright market, the total will exceed 100% — often by 30-50% in a 156-player field. That excess is the overround, also called the bookmaker's margin. A 140% overround market means the bookmaker has priced in a 40% theoretical edge across all outcomes. Your job as a bettor is to find spots where the true probability exceeds the implied probability by a margin large enough to overcome that built-in disadvantage.
A deeper exploration of odds formats, conversion shortcuts and what price movements signal about market confidence is available in my dedicated guide to reading golf betting odds. The core skill, though, is straightforward: never place a bet without knowing the implied probability it represents and how that compares to your own assessment.
The UK Golf-Betting Landscape in 2026
Something remarkable has happened to golf in Britain over the past two years, and it's reshaping the betting market from the ground up. England Golf recorded 11.83 million scores submitted through the World Handicap System in 2025 — a 16% jump on the previous year and a record since the system launched. Rounds played hit an all-time high, up 14% across the country. John Bushell, Managing Director of Sporting Insights, summed it up: "This is obviously extremely good news for the golf industry. Our sport has never been more visible, more accessible, or more popular, and huge credit should go to everyone involved." More people on courses means more people watching tournaments, and more people watching means more interest in betting markets.
UK gross gaming yield reached £4.5 billion in Q4 2025 alone, while the full-year GGY for 2023-24 hit a record £15.63 billion. Golf betting sits within one of the most financially robust regulated gambling ecosystems in the world.

For punters, this confluence of participation growth and market infrastructure creates a distinctive environment. UK-licensed bookmakers offer each-way terms that don't exist in the same form in America or Asia. The competitive landscape between operators means place terms, enhanced odds and in-play coverage are constantly improving. And the regulatory framework — for all its complexity — provides a level of consumer protection that offshore markets simply cannot match.
What makes the UK golf-betting market distinctive: Each-way betting is the default structure for outright golf wagers, offered by virtually every UK-licensed bookmaker. Place terms vary by operator and event, creating genuine shopping opportunities. In-play markets run from Thursday to Sunday with live odds updated hole-by-hole during featured coverage. Enhanced place promotions during major weeks routinely extend coverage from 5 places to 8 or even 10. Betting exchanges offer an alternative to traditional bookmaker pricing, with commission structures that can reduce the effective overround.
The regulatory side matters too, though most punters don't think about it until something goes wrong. Every UK-facing bookmaker must hold a Gambling Commission licence, comply with the Licence Conditions and Codes of Practice, and offer verified self-exclusion tools. Since December 2025, operators have been required to restrict potentially harmful promotions that encourage cross-product betting — a rule that directly affects how golf-specific offers are structured and marketed.
None of this means the UK market is perfect. Overrounds on golf outright markets remain high, often exceeding 140% for a full-field event. Bookmaker restrictions on winning accounts are widespread. And the sheer volume of promotional noise can distract from the underlying maths. The sharp punter ignores the packaging and focuses on three things: where the best place terms are, where the softest prices sit, and where the data creates a genuine information advantage over the market.
PGA Tour, DP World Tour and the UK Punter
Most UK punters bet on both tours, but few appreciate how profoundly the analytical landscape differs between them. The betting handle split tells part of the story: data from one major US sportsbook showed that 99.4% of its golf betting handle lands on PGA Tour events, with LIV Golf and other tours fighting over the remaining fraction. The DP World Tour sits somewhere in between — attracting more European interest by nature, but carrying a fraction of the data infrastructure that makes PGA Tour events so analytically rich.
PGA Tour
Full ShotLink data on every shot at every event. Strokes gained categories available within hours. Deep historical datasets stretching back over a decade. Betting markets open early in the week with strong liquidity. Field sizes range from 70 (signature events) to 156 (standard events). Higher media coverage drives faster odds adjustments — less time for the sharp bettor to exploit slow-moving lines.
DP World Tour
Limited ShotLink-equivalent data; strokes gained coverage relies on third-party providers and is often incomplete. Weaker fields at non-co-sanctioned events create more variance and potentially more value for the well-prepared punter. Each-way terms are typically equivalent to PGA Tour events, but market liquidity is lower — prices can stay soft for longer. Co-sanctioned events (where PGA and DPWT fields merge) offer a hybrid analytical environment.
The practical implication is straightforward. On PGA Tour weeks, your edge comes from interpreting data better than the market — reading strokes gained profiles more accurately, weighting course-fit variables more precisely. On DP World Tour weeks, your edge often comes from simply having data that most of the market doesn't bother to compile. I've found some of my highest-ROI bets in mid-tier DPWT events where a morning spent cross-referencing European stats with PGA Tour history for dual-status players generates insights the bookmaker's pricing model hasn't captured.
Responsible Golf Betting: Staying in Control
I'm going to be direct about something most betting content ignores or buries in a footer disclaimer. Gambling causes genuine harm to a significant number of people, and golf betting — with its long odds, weekly cadence and season-length timeline — carries specific risks that deserve honest acknowledgement. The problem gambling rate among UK adults sits at 2.7% as measured by the PGSI (Problem Gambling Severity Index), but among online sports bettors specifically, that figure jumps to 7.2%. That means roughly one in fourteen people betting on sport online in the UK meets the clinical threshold for problem gambling.
The nature of golf betting — where losing weeks are structurally normal and the temptation to chase losses after a prolonged dry spell is constant — creates a psychological environment where unhealthy patterns develop gradually. I've seen it in people I know: the unit size creeps up, the tracking spreadsheet gets abandoned because looking at the losses is uncomfortable. By the time the behaviour becomes visible, the financial damage is often significant.
The Gambling Commission, in its 2026-2027 Business Plan, stated it plainly: "The licensed gambling market in Great Britain is one of the most respected in the world. That is, in no small part, due to the Commission's unwavering focus on making gambling safer, fairer and crime free." That regulatory framework exists because the risks are real, and using the tools it provides is not a sign of weakness — it's intelligent self-management.
Tools available to UK bettors right now: Every UK-licensed bookmaker must offer deposit limits (daily, weekly, monthly), session time reminders, cooling-off periods (24 hours to 6 weeks), and self-exclusion (minimum 6 months). GamStop provides multi-operator self-exclusion with a single registration. The National Gambling Helpline (0808 8020 133) offers free, confidential support. The PGSI self-assessment is a 9-question screener available free online — it takes two minutes and can reveal patterns you might not recognise on your own.

The line between a disciplined bettor and a problem gambler isn't always obvious from the outside. It often comes down to whether you can walk away from a bet that doesn't meet your criteria, whether losing streaks change your staking behaviour, and whether the activity is still entertainment or has become compulsion. If any of those questions feel uncomfortable, the tools above exist specifically for you. Using them is part of the process, not a departure from it.
Golf Betting Tips: Frequently Asked Questions
How does each-way betting work in golf?
An each-way bet is two separate bets of equal size: one on the player to win and one on them to finish in the places (typically top 5 or top 8, depending on the bookmaker and field size). If the player wins, both halves pay out. If they finish in the places but don't win, only the place half pays — at a fraction of the outright odds, usually 1/4 or 1/5. A £5 each-way bet costs £10 total. Each-way betting is central to UK golf wagering, offering a way to profit from near-misses that would be dead losses in a straight win-only market.
What golf stats should I look at before placing a bet?
Strokes gained is the most predictive statistical framework for golf betting. Focus on SG: tee-to-green as the primary ball-striking indicator, then drill into SG: approach (the sub-category most correlated with finishing positions) and SG: putting (volatile but relevant for specific course types). Supporting stats include greens in regulation, scrambling percentage and bogey avoidance. The key is matching the right stats to each tournament's course demands, not applying the same filter to every event.
How do I find value in golf betting odds?
Value exists when the bookmaker's implied probability is lower than your own estimate of a player's true chance. Convert the offered odds to a percentage (for fractional odds: stake divided by stake plus payout), then compare against your model. If you assess a player at 6% to finish top 5 and the bookmaker's price implies 4%, there's a 2% edge. Finding these gaps consistently requires a structured process — course-fit profiling, strokes gained filtering and form-window analysis — rather than gut feeling.
What is the best type of bet for golf beginners?
Each-way bets on top-finish markets (top 10 or top 20) offer the best entry point. The strike rate is significantly higher than outright winner bets, the payouts are still meaningful, and the structure teaches you how place terms and dead heats work without the bankroll-destroying variance of backing 100/1 outrights from day one. Head-to-head matchups are another strong starting point — they reduce the field to two players and focus your analysis on direct statistical comparison rather than a 156-player puzzle.
How does the dead heat rule affect golf bets?
A dead heat occurs when two or more players tie for a position that determines whether your bet pays out — for example, three golfers sharing fifth place when your each-way bet covers top 5. Your stake is divided by the number of players sharing that position before the payout is calculated. In a three-way dead heat, your effective stake becomes one-third of the original, which significantly reduces the return. Dead heats are common in golf due to tied scores and affect place bets, top-finish markets and FRL wagers.
Is golf betting profitable long-term?
It can be, but not without a structured process. The high variance of golf — large fields, long odds, frequent losing runs — means that short-term results tell you almost nothing about long-term profitability. A positive edge of even 3-5% on implied probability, applied consistently across hundreds of bets with disciplined staking, can generate meaningful profit over a full season. Most punters who lose long-term do so because of process failures (no staking plan, no tracking, emotional adjustments) rather than inability to identify good selections.
What are the best golf betting markets for UK punters?
Each-way outright bets remain the core market for most UK golf bettors, thanks to competitive place terms and the ability to profit from top-5 or top-8 finishes. Head-to-head matchups offer lower variance and a cleaner analytical challenge. Top-finish markets (top 5, top 10, top 20) let you match conviction to risk tolerance. In-play markets have expanded rapidly, and first round leader bets offer a self-contained one-day market with distinct statistical drivers. The "best" market depends on your analytical strengths and bankroll structure.
Your Card Next Thursday Starts Here
Every piece of this guide feeds into one practical outcome: the decisions you make when Thursday's first tee time arrives. The markets section tells you where to deploy your stake. The statistics section tells you which numbers to trust. The strategy section tells you how much to risk and how to track your process. And the UK landscape section tells you what makes this market uniquely rewarding for analytical punters.
I've been refining my own process for seven years, and the single greatest lesson is that improvement is incremental. You won't build a profitable golf betting approach in a weekend. You'll build it over a season, one tracked bet and one reviewed week at a time, adjusting your model inputs as the data tells you where your edge actually lives. The punters who survive are the ones who treat the process as the product — not the individual winners, but the systematic accumulation of small edges across a 48-event calendar.
Golf betting rewards the punter who prepares with data, stakes with discipline and reviews with honesty. Start with the market that matches your analytical strength, apply the strokes gained framework to filter your selections, track every bet from day one, and accept that variance is the price of entry — not a sign that the process is broken.
Articles
Written by the editors at Golf Betting Tips.
