
Strokes Gained for Golf Betting: Turning ShotLink Data into Tournament-Week Selections
 Available in US

Three years ago I backed a player at 80/1 because his driving accuracy ranked in the top 10 on the PGA Tour. The course that week was a 7,400-yard monster where distance off the tee mattered far more than finding fairways. He missed the cut by six shots. The stat I relied on — driving accuracy — was real, but it was the wrong stat for the question I was trying to answer. That week changed how I approach golf data permanently.
Strokes gained is the framework that replaced my guesswork. Developed by Columbia professor Mark Broadie and adopted by the PGA Tour as its primary statistical language, strokes gained measures how much better or worse a player performs relative to the field average on every single shot. It is not a counting stat like fairways hit or putts per round. It is a comparative stat — and that distinction is everything when you are trying to predict who will play well this week, not who played well in general.
The PGA Tour LIVE Betcast expanded from 50 hours of live betting coverage on 6 tournaments in 2025 to over 400 hours across 12 tournaments in 2026 — a 700% increase. That expansion was built on the same data infrastructure that powers strokes gained: ShotLink, the laser-tracking system that records every shot on the PGA Tour. The betting market and the data market are converging, and the punters who understand strokes gained are better positioned to exploit that convergence than those still relying on surface-level stats.
What Strokes Gained Measures and Why Traditional Stats Fall Short
Imagine two golfers both average 29 putts per round. Traditional stats would call them equal putters. But one plays courses with large, simple greens where the field averages 28.5 putts, and the other plays courses with small, undulating greens where the field averages 30.5 putts. The first golfer is actually a below-average putter relative to the competition he faces. The second is well above average. Traditional stats hide that difference. Strokes gained reveals it.
The principle works by comparing every shot a player hits — from tee to hole — against the field average for that same situation. If the average player from 180 yards on the fairway takes 2.85 strokes to hole out, and our player takes 2.60, he has gained 0.25 strokes on that single shot. Aggregate those micro-comparisons across every shot in a round, and you have a comprehensive picture of where a player is gaining and losing relative to the field.
PGA Tour golf betting handle grew 20% in 2025, and a significant portion of the sharpest money in that market is being directed by strokes gained analysis. The reason is straightforward: traditional stats like driving accuracy, greens in regulation, or putts per round are all context-blind. They do not adjust for course difficulty, field strength, pin positions, weather, or any of the other variables that affect scoring. Strokes gained adjusts for all of them by using the field average as a baseline.
This matters for betting because the bookmaker’s odds are influenced by public perception, and public perception leans on traditional stats. A player with a high driving accuracy percentage looks impressive to casual bettors, which can compress his odds beyond what the data supports. A player with strong strokes gained numbers in the categories that matter for a specific course might be underpriced because his traditional stats look ordinary. That gap between perception and reality is where strokes gained creates betting value.
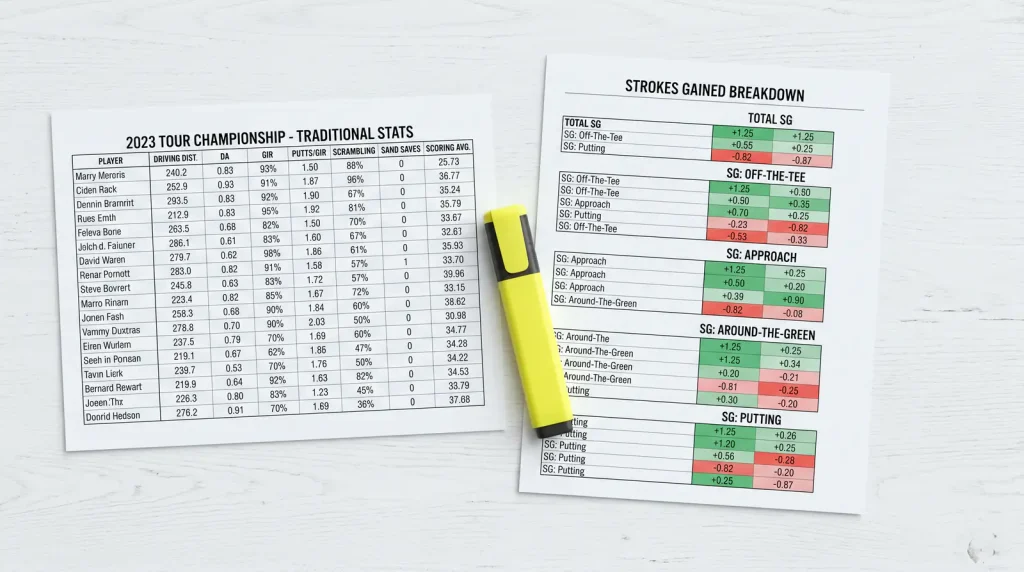
The framework is not perfect — I will cover its limitations later — but it is the closest thing golf has to an objective performance measurement system. Every other stat is a subset of what strokes gained captures. Once you learn to read SG data, the traditional stats become supporting evidence rather than primary inputs.
The Four Strokes Gained Categories and Their Betting Relevance
Strokes gained breaks down into four categories, each measuring a different phase of the game. Together they sum to total strokes gained — the overall measure of how a player performs against the field. Individually, they tell you where the performance is coming from, and that breakdown is far more useful for betting than the aggregate number.
The four categories are: SG: Off-the-Tee (driving), SG: Approach (iron shots into the green), SG: Around-the-Green (short game within 30 yards of the green edge), and SG: Putting. Each category captures a distinct skill set, and each has a different relationship with course design and conditions. A player who excels in SG: Approach but struggles in SG: Putting will thrive on courses where greens in regulation are hard to hit but putting surfaces are flat and forgiving. The same player might flounder on a course with wide fairways and treacherous, sloped greens where putting is the separating factor.

For betting, the four-category breakdown is what transforms strokes gained from a general performance metric into a course-specific prediction tool. A total SG of +1.5 means a player is 1.5 strokes better than the field average per round — impressive in isolation. But if that +1.5 comes entirely from SG: Putting, and this week’s course is a links track where the wind demands elite driving and approach play, that +1.5 is almost irrelevant to the tournament at hand. The category breakdown tells you whether a player’s strengths align with what the course will ask of him.
SG: Off-the-Tee and SG: Approach
SG: Off-the-Tee measures everything from the tee box to the point where the ball comes to rest on the fairway, rough, or elsewhere. It captures both distance and accuracy in a single number. A player who bombs it 320 yards into the rough might gain fewer strokes off the tee than a player who hits it 290 yards down the centre, because the field average from the rough is worse than from the fairway. The metric penalises wild distance and rewards controlled distance — a distinction that traditional driving stats miss entirely.
SG: Approach is, in my experience, the most predictive single category for tournament outcomes. It measures the quality of iron shots from the fairway or rough into the green, capturing proximity to the hole on approach shots. The reason it correlates so strongly with finishing position is simple: approach play determines how many birdie opportunities a player creates. A player who consistently lands his approach shots inside 20 feet faces more makeable putts than one who leaves himself 35-foot par savers. Over 72 holes, that compound advantage is enormous.
When I am building a shortlist for a given week, SG: Approach gets the heaviest weighting — roughly 35% to 40% of my total assessment. SG: Off-the-Tee gets 20% to 25%, with the exact weight depending on the course. Tight, tree-lined courses elevate the importance of tee shots. Wide, open courses with generous landing areas diminish it. The adjustment is not guesswork — you can look at historical scoring data to see which SG category has correlated most strongly with top-10 finishes at a specific venue.

SG: Around-the-Green and SG: Putting
SG: Around-the-Green covers shots played from within roughly 30 yards of the green edge that are not putts — chips, pitches, bunker shots, and those delicate flop shots that make or break a weekend round. This category is inherently volatile. A player can rank first in SG: Around-the-Green for three weeks and then drop to 80th the next. The skill is real, but the sample size per tournament is small — a player might face only 15 to 20 around-the-green shots per round, compared to 30 or more approach shots. I use SG: Around-the-Green as a tiebreaker rather than a primary input, giving it perhaps 10% to 15% of my total weighting.
SG: Putting is the most debated category among golf bettors, and for good reason. It is the least stable of the four categories over time, meaning a player’s putting performance fluctuates more week to week than his driving, approach, or short-game performance. Some analysts argue that putting is so volatile it should receive minimal weight in any predictive model. Others counter that certain green types — Bermuda grass, poa annua, bent grass — produce more predictable putting performance, and that adjusting for green surface can increase the category’s predictive value.
My position sits between the two camps. I give SG: Putting around 15% to 20% of my total weighting, but I adjust upward for courses where putting is the primary separator (think Augusta National, where the sloping greens are the defining challenge) and downward for courses where approach play dominates (like a typical Open Championship links). The key is not ignoring putting — it is calibrating how much it matters for a specific week rather than treating it as a constant.
Matching Strokes Gained Profiles to Course Demands
Pamela Maldonado’s observation that “the sharper approach is building a card with intention and direction” applies nowhere more directly than in matching strokes gained profiles to course demands. This is where the framework becomes a betting weapon rather than an academic exercise.
Every golf course has a statistical fingerprint. Some courses — long, open, with receptive greens — reward players who gain strokes primarily off the tee and on approach. Others — tight, with firm greens and heavy rough — demand accuracy and scrambling. A links course in the wind prioritises ball flight control, creative shot-making, and the ability to perform under pressure on exposed greens. Each fingerprint corresponds to a specific combination of SG categories that have historically predicted top finishes at that venue.
I build that fingerprint by looking at the last three to five years of tournament data at a given course. Which SG category showed the strongest correlation with top-10 finishes? Which category had the weakest? If SG: Approach correlates at 0.65 with top-10 performance and SG: Putting correlates at only 0.20, I know that approach play is three times as important as putting for this venue. My player shortlist should lean heavily toward strong approach players, even if their putting numbers are mediocre. For a much more detailed breakdown of how to build these profiles and apply them week by week, I have written a full piece on golf course fit betting and the methodology behind it.

The matching process is where I spend the most time in my weekly workflow. I rank the 156-player field by the weighted SG score that corresponds to the course fingerprint, then compare that ranking to the bookmaker’s implied ranking. The mismatches — players ranked highly by my SG model but priced as long shots by the bookmaker — are my primary betting candidates. Not all of them turn into bets. Some have valid reasons for being underpriced (injury, travel fatigue, recent poor form). But the mismatches are always the starting point.
One example from 2024 that illustrates the principle: a mid-ranked player was priced at 66/1 for a tournament at a course that historically rewarded elite SG: Approach. His 24-round SG: Approach ranked him 8th in the field. His traditional stats looked unremarkable — 48th in driving accuracy, 35th in putts per round — which is why the market overlooked him. He finished tied for fourth. The strokes gained profile identified the fit. The traditional stats obscured it.
Where to Find Strokes Gained Data: Free and Paid Sources
The best analysis in the world is useless without reliable data, and strokes gained data availability varies dramatically depending on which tour you are following.
The PGA Tour is the gold standard. ShotLink tracks every shot on every hole at every PGA Tour event, generating strokes gained data that is publicly available through the PGA Tour’s official statistics portal. The depth is extraordinary — you can pull a player’s SG: Approach numbers for a specific course, a specific time window, or a specific competitive context. No other professional sport offers this level of granular performance data for free.
The DP World Tour is a different story. European Tour statistics have improved significantly in recent years, but the shot-tracking infrastructure is less comprehensive than ShotLink. Strokes gained data for DP World Tour events is available through some paid platforms but not with the same granularity or reliability. Sportradar, which acquired IMG ARENA in 2025 to expand its sports data portfolio, delivers data to sportsbooks across both tours, but the punter-facing data for European events remains thinner. If you bet primarily on DP World Tour events, expect to supplement strokes gained with traditional stats and course-history analysis more than you would on the PGA Tour.
Free sources include the PGA Tour’s official website, which offers strokes gained rankings across all four categories with customisable timeframes. Paid platforms add features like custom course-fit models, head-to-head SG comparisons, and historical venue correlations. I use one paid platform alongside the free PGA Tour data, and the paid subscription has been the single best investment in my betting operation — it saves me roughly four hours of manual data work per week and provides course-fit correlations that would take me an entire evening to calculate manually.
The data landscape is improving rapidly. As golf betting volumes grow, the demand for accessible, actionable data grows with it. Tools that were available only to professional analysts five years ago are now within reach of any serious recreational punter willing to spend GBP15 to GBP30 per month on a data subscription.

A Practical Weekly Workflow Using Strokes Gained
The FedEx Cup Playoffs in August 2025 generated a 50% increase in betting handle year on year, with the Tour Championship more than doubling its volume. Those events are the apex of the data-rich season — small fields, deep form samples, and well-known courses. But the workflow I use for playoffs is the same one I use for a regular February event. The discipline is in the routine, not the occasion.
Monday: I identify the tournament, the course, and the field. I pull the course fingerprint — the historical SG category correlations for that venue — from my records or build a new one if the course is hosting a tournament for the first time.
Tuesday: I rank the field by weighted strokes gained, using the course fingerprint to set the category weightings. This produces a model ranking of all 156 players. I then pull the bookmaker’s implied ranking from the outright odds and compare the two. Players where my model ranking is significantly higher than the market’s implied ranking go onto a shortlist of eight to twelve names.
Wednesday: I refine the shortlist. I check for red flags — recent injuries, poor travel schedules, course history that contradicts the model (some players simply do not perform at certain venues despite a strong statistical fit). I also check the weather forecast and tee-time draw. Players on the shortlist who survive all three checks become active betting candidates. I finalise my bets on Wednesday evening or early Thursday morning, depending on odds movement.
Thursday through Sunday: I watch, track, and do not bet. The analysis is done. The process is complete. In-play adjustments are a separate discipline with separate rules, and I keep pre-tournament and in-play activity strictly separated to avoid letting live leaderboard emotions contaminate my pre-tournament methodology.
This workflow takes about 90 minutes on Tuesday, 30 minutes on Wednesday, and nothing on Monday beyond five minutes of setup. It is not glamorous. It does not involve brilliant insights or gut-feel masterstrokes. It is a systematic scan of data, a comparison against the market, and a disciplined filtering process. Over a full season, that system has outperformed every other approach I have tried.

Limitations: Small Samples, Course Rotation and Data Lag
Strokes gained is the best tool available. It is not a perfect one. Three limitations are worth understanding before you build a strategy around it.
First, sample size. A 24-round SG window gives you roughly 1,700 shots — enough for stable approach and tee-shot estimates, but still noisy for around-the-green and putting. A player who faced an unusually high number of difficult lies or fast greens during those 24 rounds will show a depressed SG in those categories that may not reflect his true skill level. The shorter the window, the noisier the data. The longer the window, the less responsive it is to recent changes. There is no escape from this trade-off — only awareness of it.
Second, course rotation. Many PGA Tour courses host a tournament only once per year, and some rotate on a multi-year cycle. Building a reliable course fingerprint requires at least three years of data at the same venue, and when a course undergoes renovation or a significant setup change, the historical data becomes less useful. I treat fingerprints from renovated courses as provisional until at least two post-renovation tournaments have been played.
Third, data lag. ShotLink data is typically updated within 24 to 48 hours of a tournament’s conclusion, but some third-party platforms take longer to incorporate it. If you are building your shortlist on Tuesday using data that does not include the previous week’s tournament, your SG numbers are one week stale. That one-week lag rarely changes the big picture, but for players whose performance swung dramatically in the most recent event, it can lead to slightly outdated estimates. I cross-check my model ranking against a quick scan of the previous week’s results to catch obvious discrepancies.
None of these limitations should discourage you from using strokes gained. They should encourage you to use it with appropriate humility — as the strongest available input rather than an infallible oracle.

Strokes Gained for Betting: Frequently Asked Questions
How do strokes gained stats predict golf tournament winners?
Strokes gained measures how much better or worse a player performs compared to the field average on every shot. By breaking performance into four categories — off-the-tee, approach, around-the-green, and putting — and matching those categories to the demands of a specific course, bettors can identify players whose strengths align with what the venue rewards. Players with strong strokes gained in the categories most correlated with top finishes at a given course are statistically more likely to contend.
Is strokes gained data available for the DP World Tour?
Strokes gained data for the DP World Tour is available through select paid platforms, but it is less comprehensive than the PGA Tour"s ShotLink data. The European Tour"s shot-tracking infrastructure has improved in recent years, though granularity and historical depth still lag behind the PGA Tour. If you bet primarily on DP World Tour events, expect to supplement SG data with traditional statistics and course-history analysis.
Which strokes gained category matters most for links courses?
Links courses typically elevate SG: Off-the-Tee and SG: Approach because wind exposure and firm, fast conditions demand control off the tee and precision with iron shots into small, undulating greens. SG: Putting tends to be less predictive on links because the putting surfaces are often less consistent than inland greens, introducing more randomness. SG: Around-the-Green gains importance when heavy winds push more shots off the putting surface.
The Numbers Tell a Story — Your Job Is to Listen
Strokes gained did not make me a better golf bettor overnight. It made me a better golf bettor over two years, by replacing vague impressions with specific, measurable inputs. The player I backed at 80/1 because of his driving accuracy — the one who missed the cut — would never have made my shortlist under a strokes gained framework. The data would have shown the mismatch between his skill profile and the course demands before I placed the slip.
The numbers are there, updated every week, available to anyone willing to spend the time reading them. Your job is not to invent the data. It is to build a routine around interpreting it, matching it to the course, and trusting the output over the narrative. Do that consistently, and the results follow.
Articles
Prepared by the Golf Betting Tips editorial staff.
