
Golf Betting ROI Tracking: Building a Record That Reveals Your True Edge
 Available in US

After my first full season of golf betting, I had a feeling I’d been profitable. I remembered the big wins — a 40/1 each-way place at the Players Championship, a matchup treble that paid 9/1 — and the losses felt like background noise. Then I built a spreadsheet and entered every bet from the season. I wasn’t profitable. I was down 6.2%. The wins I remembered were real; the problem was the thirty or forty losing bets between them that I’d psychologically discounted. Without a tracking record, I’d have entered season two with false confidence in a broken process. With one, I identified three specific market types where my selections were consistently wrong and cut them from my card.
Tracking isn’t admin. It’s the mechanism that converts experience into information.
What to Record in Every Golf Bet Entry
The PGA Tour recorded a 20% increase in golf betting handle in 2025, which means more bets are being placed by more people with less historical data about their own results. Every bet you place should generate a row in your tracking sheet with a minimum of twelve fields. Skip any of them and you’re leaving analytical power on the table when you review at the end of a quarter or season.

Date and tournament are obvious but essential for seasonal pattern analysis. Player name and bookmaker identify the selection and where you placed it. Market type — outright, each-way, matchup, top-5, first round leader, accumulator — is the field that most bettors forget and the one that matters most. I discovered my edge was concentrated in matchups and top-10 finishes only because I’d tagged every bet by market type. Without that tag, my positive matchup ROI was invisible inside an aggregate number dragged down by unprofitable outrights.
Odds at placement and odds at kick-off capture whether you’re getting value early or late in the week. If your pre-tournament selections consistently drift (shorten) between placement and tee-off, you’re identifying value before the market catches up — a genuine edge signal. If they consistently steam (lengthen), you’re systematically picking players the market is abandoning. Stake in pounds and potential return complete the financial record.
Result needs more granularity than “win” or “lose.” I use five categories: win, each-way place (win half lost), each-way place (both halves won), loss, and void. For each-way bets, recording the place-half return separately from the win-half allows you to analyse whether your selections are consistently placing without winning — which might indicate that your course-fit model identifies contenders but not champions, a valuable diagnostic insight.
Finally, two qualitative fields: confidence rating (1-3) at time of placement and a post-result note explaining why the selection won or lost. The confidence rating, tracked over 200+ bets, tells you whether your subjective assessment carries predictive value — critical information if you’re considering moving from flat to Kelly staking. The post-result note forces reflection that prevents the same mistake from recurring.

Calculating ROI, Yield and Flat-Stake Profit
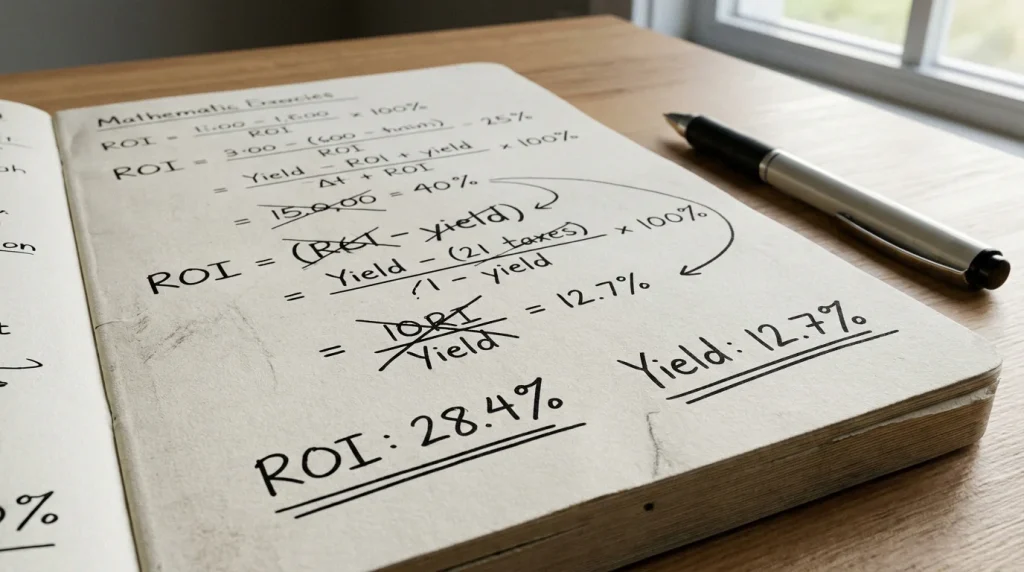
Three numbers matter. ROI — return on investment — is the most intuitive: total returns minus total stakes, divided by total stakes, expressed as a percentage. A £5,000 total stake that generates £5,400 in returns produces an ROI of 8%. That number tells you whether your process is profitable in aggregate, but it can be misleading if your staking isn’t flat because a few large bets can dominate the calculation. If you add the implied probabilities of every player in a golf outright market, the total exceeds 100% by 30-50% — that overround is the headwind you’re fighting. A positive ROI means you’re overcoming it.
Flat-stake profit normalises the picture. Recalculate your results as if every bet had been placed at exactly one unit, regardless of your actual stakes. This strips out staking variation and shows whether your selections — independent of position sizing — generate edge. If your actual ROI is positive but your flat-stake ROI is negative, your profitability is coming from staking decisions (perhaps a lucky large bet that happened to win) rather than selection quality. That’s a fragile foundation.
Yield is flat-stake profit divided by the number of bets, expressed as a per-bet average. A yield of £0.08 per £1 staked means you’re making 8p on every pound wagered, on average. Yield is the purest measure of selection quality and the number you should optimise for. The three FedEx Cup Playoff events in 2025 saw betting handle rise 50% year-on-year — more volume means more bets to track, and yield keeps your performance metric independent of volume changes.
I review all three numbers quarterly. ROI tells me whether the bankroll is growing. Flat-stake profit tells me whether my selections are the reason. Yield tells me how much edge each bet carries. When all three are positive and aligned, the process is working. When they diverge — positive ROI but negative flat-stake profit, for example — I know to investigate staking rather than selection.
Spotting Patterns: Market, Tour and Seasonal Trends
The most valuable output of tracking isn’t the aggregate number. It’s the filtered breakdowns. After two full seasons, I sliced my data by market type, tour, season quarter and odds band. The patterns were stark and would have been invisible without granular tracking.
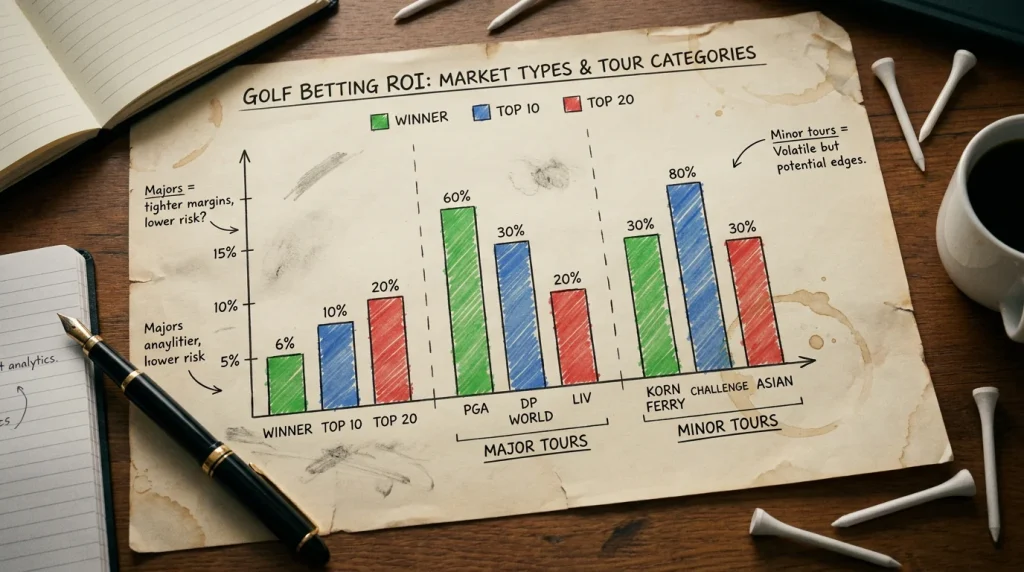
Market type was the most revealing filter. My matchup bets showed a +11% ROI. My outright bets at 30/1 or shorter showed +4%. My outright bets above 50/1 showed -18%. That last number was painful to see, but it explained why my overall ROI was only marginally positive despite strong performance in two market categories. The long-shot outrights were draining the profit that the matchups and value outrights were generating. I cut bets above 50/1 from my card the following season and my aggregate ROI jumped by 6 percentage points.
Tour-level analysis revealed that my PGA Tour selections outperformed my DP World Tour selections by a wide margin. The reason was data quality: my models were built on ShotLink data that doesn’t exist for most DPWT events. I was applying a PGA-calibrated tool to a European context and producing weaker results. Rather than abandoning DP World Tour betting entirely, I adjusted: reduced stakes on DPWT events and limited my selections to co-sanctioned tournaments where PGA Tour data was available for most of the field.
Seasonal trends showed a clear peak in my ROI during the spring months (March through May) and a trough in autumn. The spring peak coincided with the period where form data from the winter season stabilised into reliable patterns. The autumn trough coincided with schedule fatigue — both the players’ and mine. I was placing the same number of bets per week in October as in April, but my analytical rigour was declining because I was tired after eight months of weekly process. The fix was a planned staking reduction in the final quarter: fewer bets, smaller stakes, and a formal two-week break in December for model recalibration.

ROI Tracking: Common Questions
How many golf bets do I need before ROI becomes meaningful?
A minimum of 200 bets provides a rough directional signal, but 500+ bets across a full season are needed before filtered breakdowns by market type, tour and odds band become statistically meaningful. Golf betting carries high variance — outright strike rates below 5% mean long losing streaks are structurally normal — so small samples produce wildly unreliable ROI figures. Track from your first bet but reserve judgement on your process until you have at least two full seasons of data.
Should I track each-way win and place halves separately?
Yes. Recording the win-half and place-half returns separately reveals whether your selections consistently place without winning. If your place-half ROI is strongly positive but your win-half ROI is negative, your course-fit model may be identifying contenders (players who finish in the top 6-8) but not champions. That diagnostic insight is invisible if you track each-way bets as a single combined result. Separate tracking also allows accurate ROI calculation for the place component, which has fundamentally different strike rates and expected returns.
Articles
Written by the editors at Golf Betting Tips.
