
Golf Form Analysis for Betting: Choosing the Right Time Window and Avoiding Recency Bias
 Available in US

A mate of mine has been betting golf since 2019 using the same method: check who finished well last week, back them again this week. His logic sounds reasonable until you see the numbers. Over five years, his ROI is negative 14%. The problem isn’t that recent form is irrelevant — it is relevant. The problem is that “last week’s result” is the worst possible proxy for form, because a single 72-hole tournament is a tiny sample dominated by putting variance and field-specific noise. What he calls form analysis is actually recency bias wearing a reasonable disguise.
The PGA Tour recorded a 20% increase in golf betting handle in 2025, and the influx of new bettors has made recency-driven pricing more common, not less. When a player wins on Sunday, their Tuesday outright odds for the next event shorten dramatically — often by 30-40% — even though the statistical evidence that winning predicts near-term future winning in golf is weak. That overreaction is where value hides, but only for bettors who use form analysis correctly.
12, 24 and 36-Round Form Windows: What Each Reveals
The central question in form analysis is: how far back should I look? Too narrow a window and you’re chasing noise. Too wide and you’re measuring a player who may no longer exist — fitness, equipment, confidence, and technique all evolve over a season.
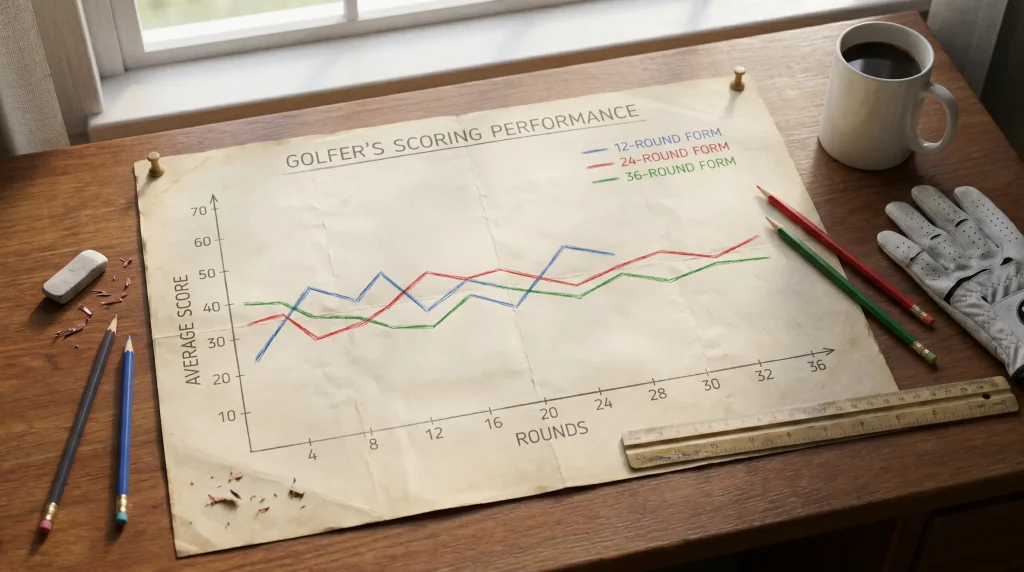
My answer, after extensive testing: 24 rounds is the primary window. A 12-round window captures approximately three events — enough to identify a genuine form shift but volatile enough that one bad tournament skews the picture. A 36-round window captures roughly nine events — stable but slow to detect changes in underlying performance. The 24-round window, covering about six events, balances responsiveness and stability better than either extreme. I use strokes gained tee-to-green over the last 24 rounds as my primary form indicator, because tee-to-green strips out putting variance and gives me a read on ball-striking quality that’s more predictive of future performance.
That said, I use the 12-round window as a secondary check. If a player’s 12-round SG: tee-to-green is significantly higher than their 24-round number, they’re trending upward — the recent work is better than the longer-term baseline. If the 12-round number is significantly lower, they’re trending downward. These trend signals don’t override the 24-round baseline, but they adjust my probability estimates at the margins. A player whose 24-round numbers make them a borderline selection moves to a clear “bet” if the 12-round trend is strongly positive, and drops off the card if the trend is strongly negative.

Regression to the Mean: When Hot Streaks Mislead
Regression to the mean is the most important statistical concept in golf betting, and the most widely ignored. The FedEx Cup Playoffs saw handle rise 50% year-on-year in 2025, and the post-playoff period is where regression effects are most visible: players who peaked during the playoffs often start the following season below their own average because the peak was partly driven by unsustainable performance in one or two statistical categories.
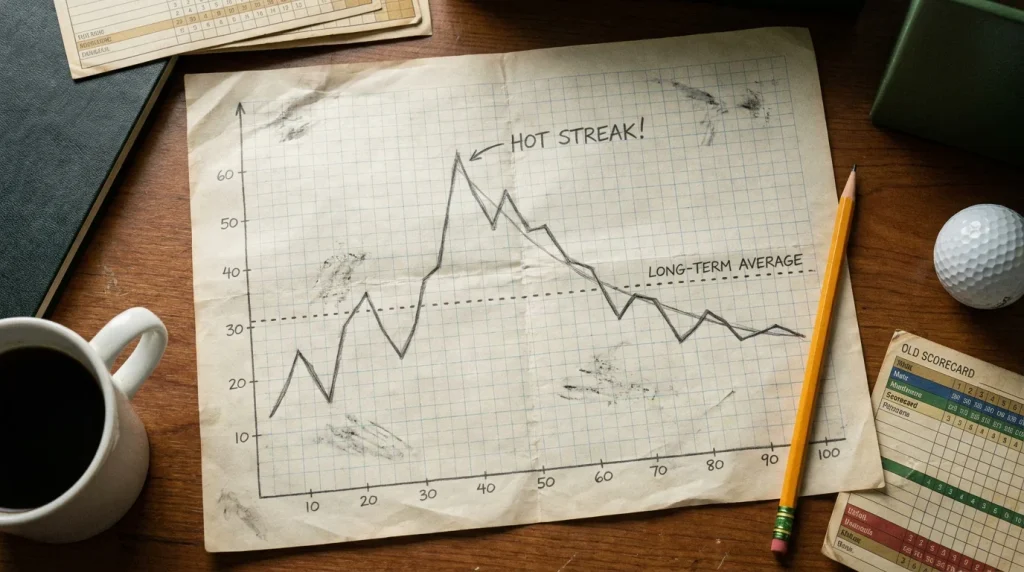
Here’s the core principle. Every measurable aspect of golf performance contains a skill component and a randomness component. Over a long sample, the skill component dominates and you see a player’s true level. Over a short sample, the randomness component can overwhelm the signal. A player who gains 3.0 strokes putting per round over a two-week stretch is almost certainly experiencing a hot putter rather than a permanent skill upgrade. Over 24 rounds, that putting average will regress toward their long-term mean — typically somewhere between 0.0 and 0.5 for a solid putter.
The betting implication is direct: if a player’s recent hot streak is concentrated in volatile categories (putting, scrambling), the market will overprice them going forward. If the hot streak is concentrated in stable categories (SG: approach, SG: off-the-tee), the hot streak is more likely to persist and the market may actually be underpricing the continuation. Distinguishing between the two requires decomposing a player’s recent results into sub-category performance — which brings us back to the strokes gained framework as the essential analytical tool.
I apply a specific regression formula to my probability estimates: for any player whose 12-round strokes gained average in a given category sits more than 1.5 standard deviations above their 36-round average, I regress that category 40% toward the longer-term mean before running my model. The adjustment sounds aggressive, but it’s calibrated against three seasons of tracking data. Without the regression, my model overprices recently hot players and underprices recently cold ones — a pattern that cost me roughly 3% ROI per season before I built the correction into the process. Regression isn’t pessimism. It’s respect for the mathematics of sample size in a sport where any four-round stretch is too short to separate skill from luck.

Form vs Strokes Gained: Two Lenses, One Card
A veteran betting analyst whose work I respect once told me: “Form tells you the story the player wants you to see. Strokes gained tells you what actually happened on the course.” That distinction has shaped how I build my weekly card. Form — as expressed by recent finishing positions and scoring averages — describes outcomes. Strokes gained describes processes. Outcomes are noisy and influenced by luck; processes are more stable and predictive.
My practical approach uses both lenses in a specific sequence. First, I filter the field by course-fit profile using strokes gained data. Second, I check the 24-round form window to confirm that the strokes gained profile is current, not historical. Third, I look at finishing positions as a reality check — a player whose strokes gained numbers are elite but whose finishes have been mediocre might be experiencing putting variance or mental lapses that the strokes gained data alone doesn’t capture.
The two lenses conflict most often at the extremes. A player on a five-tournament top-10 streak whose strokes gained numbers are average is a regression candidate: the results are ahead of the underlying skill. A player who’s missed three consecutive cuts but whose SG: tee-to-green is in the top 15% of the field is a value play: the results lag behind the underlying skill, typically because putting has been poor. In both cases, the strokes gained framework provides the more accurate forward-looking signal.

Golf Form Analysis: Common Questions
How many rounds of form should I check before a golf bet?
A 24-round window — approximately six tournaments — provides the best balance between responsiveness and stability. Use this as your primary form indicator, supplemented by a 12-round window to detect recent trends. Avoid relying on a single tournament result as a form signal; the sample is too small to distinguish genuine skill shifts from short-term noise.
Does recent good form guarantee a strong tournament finish?
No. Recent good form increases the probability of a strong finish, but it does not guarantee one. Golf performance contains significant random variance, particularly in putting and scrambling. A player on a hot streak driven by unsustainable putting will regress toward their long-term mean, often sooner than the market expects. Decompose recent form into strokes gained sub-categories to distinguish sustainable skill from temporary luck.
Articles
Published by the Golf Betting Tips team.
